


 분야
분야- Population : Korea & New-Zealand
- GDP per capital : Korea
- Major industry : Korea
Trade statistics of countries
[Korea]
- Export
- Import
- Potential partner
[New-Zealand]
- Export
- Import
- Potential partner
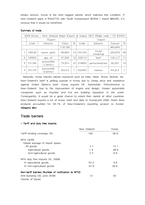
Trade barriers
- Tariff and duty free imports
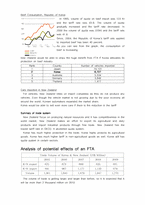
Analysis of potential effects of an FTA
- Comparative advantage
- Trade diversion
- Gravity model
Prospects for an FTA, including possible obstacles
Summary
Bibliography
Appendices
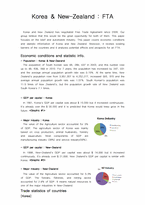
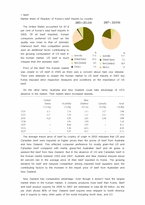
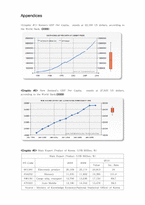
In 1981, Korea's GDP per capital was about $ 10,000 but it increased continuously. It's already over the $ 20.000 and it is predicted that Korea would keep grow in the future.
- Major industry : Korea
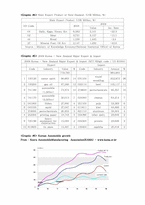
The value of the Agriculture sector accounted for 3% of GDP. The agriculture sector of Korea was mainly based on crop production, animal husbandry, forestry and aquaculture. Most components of GDP are manufacturing industry (39%) and service industry(59%).
- GDP per capital : New-Zealand
In 1998, New-Zealand's GDP per capital was about $ 14,000 but it increased continuously. It's already over $ 21,000. New Zealand's GDP per capital is similar with Korea.
- Major industry : New-Zealand
The value of the Agriculture sector accounted for 5.3% of GDP. The forestry, fisheries, and mining sector accounted for 2.8% of GDP. It means natural resources is one of the major industries in New-Zealand.
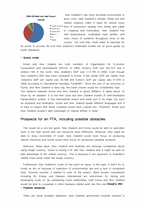
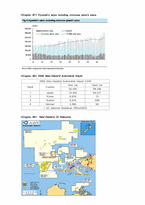
Trade statistics of countries
[Korea]
- 오늘 본 자료가 없습니다.
- 임신 중 태교의 개념과 중요성, 부성태교의 의의, 우리나라의 태교문헌 고찰, 태교의 종류와 내용
- 영유아보육, 미혼모 가정, 한부모가정, 다문화가정, 새터민 가정, 중독가정, 조손가정 중 한 가지 주제를 택하여 관련 기사 5편으로 찾아 내용을 요약 정리 한 후, 개인적인 견해 및 느낀 점을 작성하시오
- 보웬의 다세대 정서체계 가족치료 모델이 가계도 분석을 통해 가족에게 통찰을 제공한다면 경험적 가족치료 모델에서 가족에게 제공하고자 하는 것은 무엇인지 비교하시오
- 사회복지실천 모델(인지행동모델 해결중심모델 위기개입모델) 중 1가지를 선택하여 기본개념을 설명하고 본인의 사례를 적용하여 자신의 생각을 기술하세요
- 사회문제의 본질을 이해하는 쟁점에 대해 사례를 들어 서술하시오
해당 정보 및 게시물의 저작권과 기타 법적 책임은 자료 등록자에게 있습니다. 위 정보 및 게시물 내용의 불법적 이용,무단 전재·배포는 금지되어 있습니다. 저작권침해, 명예훼손 등 분쟁요소 발견 시 고객센터에 신고해 주시기 바랍니다.


