1.Introduction
2.Vision
3.Mission
4.Brand Value
5.Company History
6.Top Accreditations
Part 2. Financial Analysis
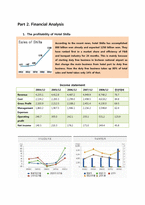
1.The profitability of Hotel Shilla
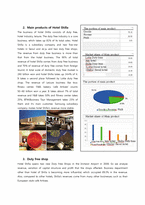
2.Main products of Hotel Shilla
3.Duty free shop
4.Balance sheet
5 Stock and Issues
Part 3. Shilla Hotel Industry’s Value Creation Structure
and Key Value Driver
1.Rooms
2.F&B
3.Duty Free Shop
4.Other facilities
Part 4. Required Tasks for World Scale Chain Development
Part 5. Major Trends in Global Hotel Industry
A.E-technology Tactics
B.Target the Seniors
C.Event Based Marketing
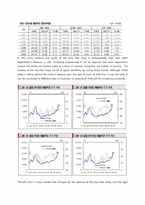
The left chart is stock market that changes by the revenue of the duty free shops and the right one is a data that represents the stock price and profits of hotel business without the shops. The profit structure of the industry other than hotel is getting better. It makes the stock price higher. It means that there is a close relationship between them.
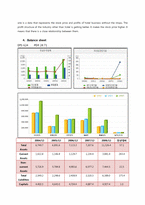
4. Balance sheet
EPS 624 PER 28.71
2004/12 2005/12 2006/12 2007/12 2008/12 전년대비
Total Assets 6,749.7 6,891.6 7,113.3 7,207.6 11,326.4 57.1
Current Assets 1,022.8 1,106.8 1,129.7 1,130.4 3,881.9 243.4
Non-current Assets
5,726.9
5,784.8
4,983.6
6,077.2
7,444.5
22.5
Total Liabilities 2,349.2 2,248.6 2,408.9 2,320.3 6,389.0 175.4
Capitals 4,400.5 4,643.0 4,704.4 4,887.4 4,937.4 1.0
5 Stock and Issues
In the 2005, duty free shop’s revenue increased sharply, due

- 오늘 본 자료가 없습니다.
- (A+) [인간관계론] 4주 1강에서 매슬로우의 욕구 5단계에 대해 학습하였습니다. 개인행동은 일반적으로 특정 시점에서 가장 강한 욕구에 의해서 결정된다고 매슬로우는 정의하였습니다. 매슬로우의 욕구 이론을 본인의 상황에 맞게 설명 한 후, 욕구이론의 장단점을 제시해 봅시다.
- [경제학개론 A+받은자료] 수요곡선과 공급곡선이 일반적인 경우 수요의 가격탄력성이 공급에 비해 비탄력적인 경우 소주에 조세를 부과하면 소주시장에 어떤 변화가 있는지 다음 질문에 답해봅시다.
- 쿠팡 마케팅 4P전략과 쿠팡 SWOT,STP분석 및 쿠팡 기업현황과 미래전략방향 제시
- 경영전략론_1 산업의 수익을 결정하는 마이클 포터의 5force에 대하여 특정 산업의 예를 들어 설명하시오 2 핵심역량을 결정하는 3가지 요인과 핵심역량 전략에 관하여 사례를 통하여 설명하시오 3 4차 산업혁명에 따른 제품(product) 일하는 과정(process) 요구하는 사람과 깅버문화(people)가 어떻게 변화하여야 하는지에 관한
- [벤처기업][벤처][기업][벤처기업 정의][벤처기업 특징]벤처기업의 정의, 벤처기업의 특징, 벤처기업의 선정범위, 벤처기업의 경제적 효과, 벤처기업의 성장과정, 벤처기업의 기업가정신, 벤처기업의 합병 분석
해당 정보 및 게시물의 저작권과 기타 법적 책임은 자료 등록자에게 있습니다. 위 정보 및 게시물 내용의 불법적 이용,무단 전재·배포는 금지되어 있습니다. 저작권침해, 명예훼손 등 분쟁요소 발견 시 고객센터에 신고해 주시기 바랍니다.


 분야
분야

