


 분야
분야Ⅰ. 실험목적
Ⅱ. 이론
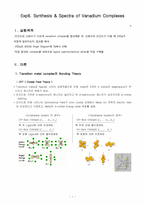
1. Transition metal complex의 Bonding Theory
- CFT ( Crystal Field Theory )
- LFT ( Ligand Field Theory )
- LFSE(Ligand Field Stabilization Energy), 10Dq(Δo)
2. 10Dq에 영향을 주는 요인
- Transition metal의 산화수
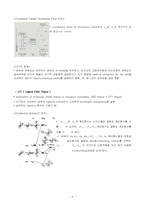
- Ligand effect
➁The Chelate effect
3. 배위 화합물의 전자 스펙트럼
-Spin Selection Rules(스핀 선택 규칙)
-Correlation Diagram(상관도표)
- Orgel diagram
Ⅲ. 실험 방법
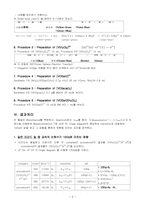
1. Synthesis of (NH4)2[VO(tart)]․H2O [VO3-(Ⅴ) → VO2+(Ⅳ)]
2. Synthesis of [VO(acac)2] [V2O5(Ⅴ) → VO2+(Ⅳ)]
3. Solution preparation for spectra
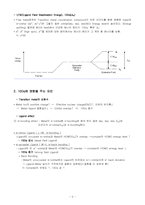
4. Procedure 1 : Preparation of [VO(H2O)5]2+ [ VO3-(Ⅴ) → VO2+(Ⅳ) ]
5. Procedure 2 : Preparation of [V(H2O)6]2+ [ VO3-(Ⅴ) → V2+(Ⅱ) ]
6. Procedure 3 : Preparation of [V(H2O)6]3+ [VO2+(Ⅳ) +V2+(Ⅱ) → V3+]
산화제(Blue) 환원제(Violet-Blue) (Brown) (Green)
7. Procedure 4 : Preparation of [VO(tart)]2-
8. Procedure 5 : Preparation of [VO(acac)2]
9. Procedure 6 : Preparation of [VO(tart)(H2O)2]
Ⅳ. 결과처리
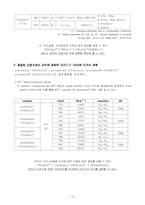
1. 같은 리간드 일 때 금속의 산화수가 10Dq에 미치는 영향
2. 동일한 산화수에서 금속에 결합한 리간드가 10Dq에 미치는 영향
Ⅴ. 실험 시 주의 사항
Ⅵ. Reference
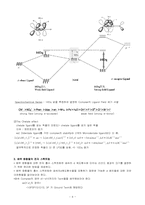
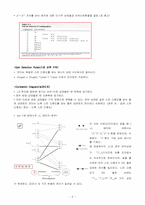
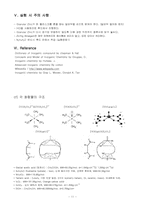
• spectra를 측정하여 orgel diagram을 통해 10Dq를 알아 낼 수 있다.
• Ligand field 안에서의 Transition Metal Atom의 E-level split을 나타낸다.
• Transition Metal Complex의 에너지 상태 중 Ground State와 같은 spin multiplicity를 가지는 것만 나타낸 diagram.
• 세로축 : Energy, 가로축 : strength of the ligand field
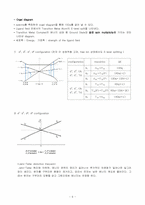
① d2, d3, d⁷, d⁸ configuration (전자 간 상호작용 고려, free ion 상태에서도 E level splitting )
configuration
transition
ΔE
d3, d8, Oh
d2, d7, Td
ῦ₁
A2g→T2g
10Dq
ῦ₂
A2g→T1g(F)
18Dq(-C)
ῦ₃
A2g→T1g(P)
12Dq+15B(+C)
d2, d7, Oh
d3, d8, Td
ῦ₁
T1g→T2g
8Dq(+C)
ῦ₂
T1g(F)→T1g(P)
6Dq+15B(+2C)
ῦ₃
T1g→A2g
18Dq(+C)
② d1, d4, d⁶, d⁹ configuration


