ration을 위한 계산
a= data(1) %검량선 방정식에 들어갈 계수
b= data(2)
x_plot = 0:0.001:1;
n=max(size(x_plot));
for i = 1:n
y_plot(i)=a*x_plot(i)+b; % 0~1까지 0.001 단위로 검량선 ploting
end
figure,plot(y_plot, x_plot, 'r', x, y, 'rx')
title('Methanol-1st order');
xlabel('Peak Area %');
ylabel('Volume fraction');
v=[0,100,0,1];
axis(v);
- Or
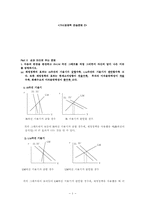
2. (총수요-총공급) 아래와 같은 경제에 대해 생각해 보자.
모든 노동자와 기업은 임금협상을 통해 명목임금을 결정하며 기업은 고용량을 결정할 수 있다. 총생산함수는 다음과 같다. (즉 자본에 대해서는 일단 생각하지 말기로 하자)
, N은 고용된 노동자 수
(a) 노동수요 함수를 도출해 보시오.
을 N
통계학은 불확실한 현상을 대상으로 하여 그와 관련된 자료를 수집하여 정리․분석하고 추론하고 예측하는 방법을 다루는 학문이며, 관찰과 실험결과를 토대로 한 귀납적 사고를 근간으로 한다. 자료산출을 위한 설계와 자료의 수집, 수집된 자료의 특성과 규칙의 탐색, 그리고 수학적 모델의 적용
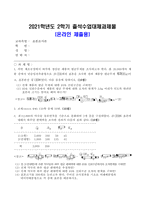
1. 어떤 제조공장에서 하루에 생산된 제품의 평균무게를 조사하고자 한다. 총 20,000개의 제품 중에서 단순임의추출법으로 개의 표본을 조사한 결과 제품당 평균무게 (g)이고, 표본분산 이었다. 다음 물음에 답하시오. (10점)
(1) 전체 제품의 평균 무게에 대한 95% 신뢰구간을 구하면?
크기 인 모집단에
situation. In addition to that, the president of one carrier in the States said that a cash flow from its operations won’t meet liquidity needs and that it could run out of cash before year’s end.
Furthermore, FSCs have been spoiled by the increase of fuel cost which takes a big share of their operational cost and the decrease of the number of frequent flyers or long-distance customers.