1. Introduction
2. The Demographic Transformation
1) Increasing Life Expectancies
2) Decreasing Fertility Rates
3) Population Aging
3. Implications for Fiscal Balance
1) Changes in life expectancy
2) Effect on Public Budgets
3) Solution
4. Economic Growth and Labor Market Challenges
1) Expected Decline in labor force
2) The Economics of National Output and Growth
3) Savings and Investment in Aging Populations
4) Population Aging and Technical Process
5) Solution
5. The Challenges to Financial Markets
6. Implications for International Relations and Stability
1) Political power theory
2) The Global Generation Gap
3) The Global Challenge
7. Conclusion
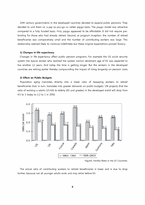
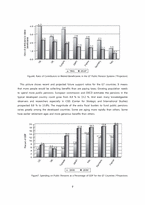
As a result, this combined effect of increasing life expectancy and decreasing fertility causes population aging. Figure 3 shows the proportion of population in the developed and developing county at aged 65. We can know the proportion of elderly is growing worldwide and then, this proportion will be continually increasing in the future.
Figure3. Percentage of World’s Population Aged 65 and Over(*projection)
3. Implications for Fiscal Balance
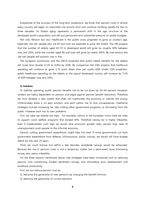
Economic insecurity and resulting social unrest occasioned by ever-expanding populations of involuntarily unemployed dominated social thinking in developed countries during much of the 20th century. As the average lifetime is getting higher, the percentage of World`s population aged 65 and over is going up.
Figure4. Percentage of World’s Population Aged 65 and over (*Projection)
20th century governments in the developed countries decided to expand public pensions. They decided to und them on a pay-as-you-go so called paygo basis. The paygo model was attractive compared to a fully funded basis. First, paygo appeared to be affordable. It did not require pre-funding for those who had already retired. Second, at program inception, the number of retired beneficiaries was comparatively small and the number of contributing workers was large. This relationship seemed likely to continue indefinitely but these original expectations proved illusory.
1) Changes in life expectancy
Changes in life expectancy affect public pension programs. For example the US social security system the typical worker who reached the system normal retirement age of 65 was expected to live another 12 years. And today the time is getting longer. But the workers in the developed countries are retiring earlier thereby compounding the impact of rising longevity on pension costs.
2) Effect on Public Budgets
Population aging translates directly into a lower ratio of taxpaying workers to retired beneficiaries that, in turn, translates into greater demands on public budgets. UN projects that the ratio of working-a adults (15-64) to elderly (65 and



 분야
분야


