논문연구-An evolutionary economic-statistical design for VSI X control charts under non-normality

 1  논문연구-An evolutionary economic-statistical design for VSI X control charts under non-normality-1
 2  논문연구-An evolutionary economic-statistical design for VSI X control charts under non-normality-2
 3  논문연구-An evolutionary economic-statistical design for VSI X control charts under non-normality-3
 4  논문연구-An evolutionary economic-statistical design for VSI X control charts under non-normality-4
 5  논문연구-An evolutionary economic-statistical design for VSI X control charts under non-normality-5
 6  논문연구-An evolutionary economic-statistical design for VSI X control charts under non-normality-6
 7  논문연구-An evolutionary economic-statistical design for VSI X control charts under non-normality-7
 8  논문연구-An evolutionary economic-statistical design for VSI X control charts under non-normality-8
 9  논문연구-An evolutionary economic-statistical design for VSI X control charts under non-normality-9
 10  논문연구-An evolutionary economic-statistical design for VSI X control charts under non-normality-10
 11  논문연구-An evolutionary economic-statistical design for VSI X control charts under non-normality-11
 12  논문연구-An evolutionary economic-statistical design for VSI X control charts under non-normality-12
 13  논문연구-An evolutionary economic-statistical design for VSI X control charts under non-normality-13
 14  논문연구-An evolutionary economic-statistical design for VSI X control charts under non-normality-14
 15  논문연구-An evolutionary economic-statistical design for VSI X control charts under non-normality-15
 16  논문연구-An evolutionary economic-statistical design for VSI X control charts under non-normality-16
 17  논문연구-An evolutionary economic-statistical design for VSI X control charts under non-normality-17
 18  논문연구-An evolutionary economic-statistical design for VSI X control charts under non-normality-18
 19  논문연구-An evolutionary economic-statistical design for VSI X control charts under non-normality-19
 20  논문연구-An evolutionary economic-statistical design for VSI X control charts under non-normality-20
※ 미리보기 이미지는 최대 20페이지까지만 지원합니다.
  • 분야
  • 등록일
  • 페이지/형식
  • 구매가격
  • 적립금
자료 다운로드  네이버 로그인
소개글
논문연구-An evolutionary economic-statistical design for VSI X control charts under non-normality에 대한 자료입니다.
목차
1. INTRODUCTION
2. VSI
3. Burr
4. Cost quality
5. GA
6. Example
7. Conclusion
본문내용
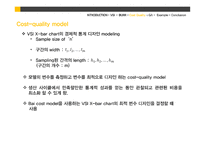
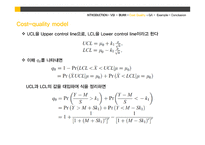
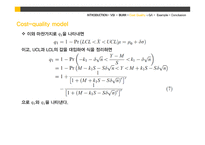
Cost-quality model
VSI X-bar chart의 경제적 통계 디자인 modeling
Sample size of‘n’

구간의 width : 𝐼_1, 𝐼_2,…,𝐼_𝑚

Sampling된 간격의 length : ℎ_1,ℎ_2,…,ℎ_𝑚
(구간의 개수 : m)

모델의 변수를 측정하고 변수를 최적으로 디자인 하는 cost-quality model

생산 사이클에서 만족할만한 통계적 성과를 얻는 동안 관찰되고 관련된 비용을 최소화 할 수 있게 함.

Bai cost model을 사용하는 VSI X-bar chart의 최적 변수 디자인을 결정할 때
사용

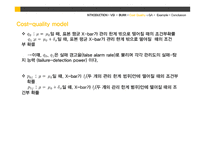
프로세스는 최초에 관리 상태(control state)에 있다고 추측

프로세스는 프로세스 내에서 fixed shift를 일으키는 이상 요인에 의해 방해 받음

프로세스를 방해하는 이상요인의 inter-arrival time은 1/λ 를 평균으로 가지는 지수분포를 따름

샘플 n개는 각각의 sampling point에서 추출함

표본 평균이 관리 한계 안에 존재하는 경우
→ 이때의 값은 다음 샘플링 구간을 결정하는데 사용됨 ⇒ 샘플링 구간이 바뀜

표본 평균이 관리 한계를 넘어설 경우
→ 프로세스는 멈추고 이상요인을 찾고 프로세스를 조정하기 위해 검색
을 실행함
오늘 본 자료
더보기
  • 오늘 본 자료가 없습니다.
해당 정보 및 게시물의 저작권과 기타 법적 책임은 자료 등록자에게 있습니다. 위 정보 및 게시물 내용의 불법적 이용,무단 전재·배포는 금지되어 있습니다. 저작권침해, 명예훼손 등 분쟁요소 발견 시 고객센터에 신고해 주시기 바랍니다.