Data description
2.1 Variable selection
Our group started to think about the various factors that can be representative of the socio-economic elements considering the interrelationship with IQ scores. Finally, we selected 8 variables to explain the differences of IQ scores among the countries: GDP per capita, happiness index, duration of education, life expectancy, urbanization, corruption pe
Database analyzing system. Using a value of the function and accumulated data, user can get an output. Since this system is used for a long time and freely interlocks among existing databases, it provides high reliability.
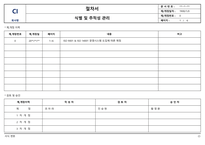
1.3 Database structure in G market
G market has 3 main databases –Member DB, Item DB and Order DB-. The structure and details for each DB will be followed.
2. HARD
2.4. Bonjean Curve
많은 학생들이 Bonjean Curve 에 대해 답을 하지 못하였다고 하셨다. 우리 조원들도 이 문제에 대해 거의 답을 하지 못하였다고 했다. Bonjean Curve는 부력의 개념이다.
그림 Bonjean Curve
임의의 수선에서 횡단면의 면적은 Simpson's 1st Rule 같은 방법으로 구할 수 있고 이를 수선변화에 따른 곡
Ⅰ. Introduction
1. Study background and objectives
Recently, due to environmental pollution and climate change, attention to environment is more growing than ever. Especially, buildings form 40% of energy and resource consumption, 30-40% of carbon dioxide emission, 20-25% of waste discharge, 17% of water consumption, and 25% of wood consumption, so buildings are mainly responsible for
Ⅰ. Introduction
The goal of Multivariate statistical analysis(MSA) is dimension reduction of data. Especially, visualization of data is very important. In various methods of MSA, Multidimensional scaling(MDS) is introduced and discussed as a graphical method to complement conventional descriptive and confirmatory methods in validation and analysis of QOL data. The use of MDS is illustrated i